Participatory approach to a complex spatially integrated design process
This website & digital tool is developed by: Anne Vader, Niene Boeijen & Naomi Bueno de Mesquita
In commission by the Design Academy Eindhoven, I spend a year as a research assistent for the project GO CAWH led by Rijkswaterstaat.
More information on the project and an insight in the research I did for this project, have a look at the GO CAWH end report from the DAE
The end product we developed as the participatory part from DAE is a interactive tool (website) showing the approach from the participatory perspective to complex spatially integrated design processes.
The website is developed by me; In React, Vite, TypeScript and D3.js. While closely collaborating with Anne Vader and Naomi Bueno de Mesquita how the layout, content and interactivity could best support the participatory approach. It was an interesting struggle to combine technology with a participatory design process. In which both sides learned a lot, got confused but we always found a way back to each other.
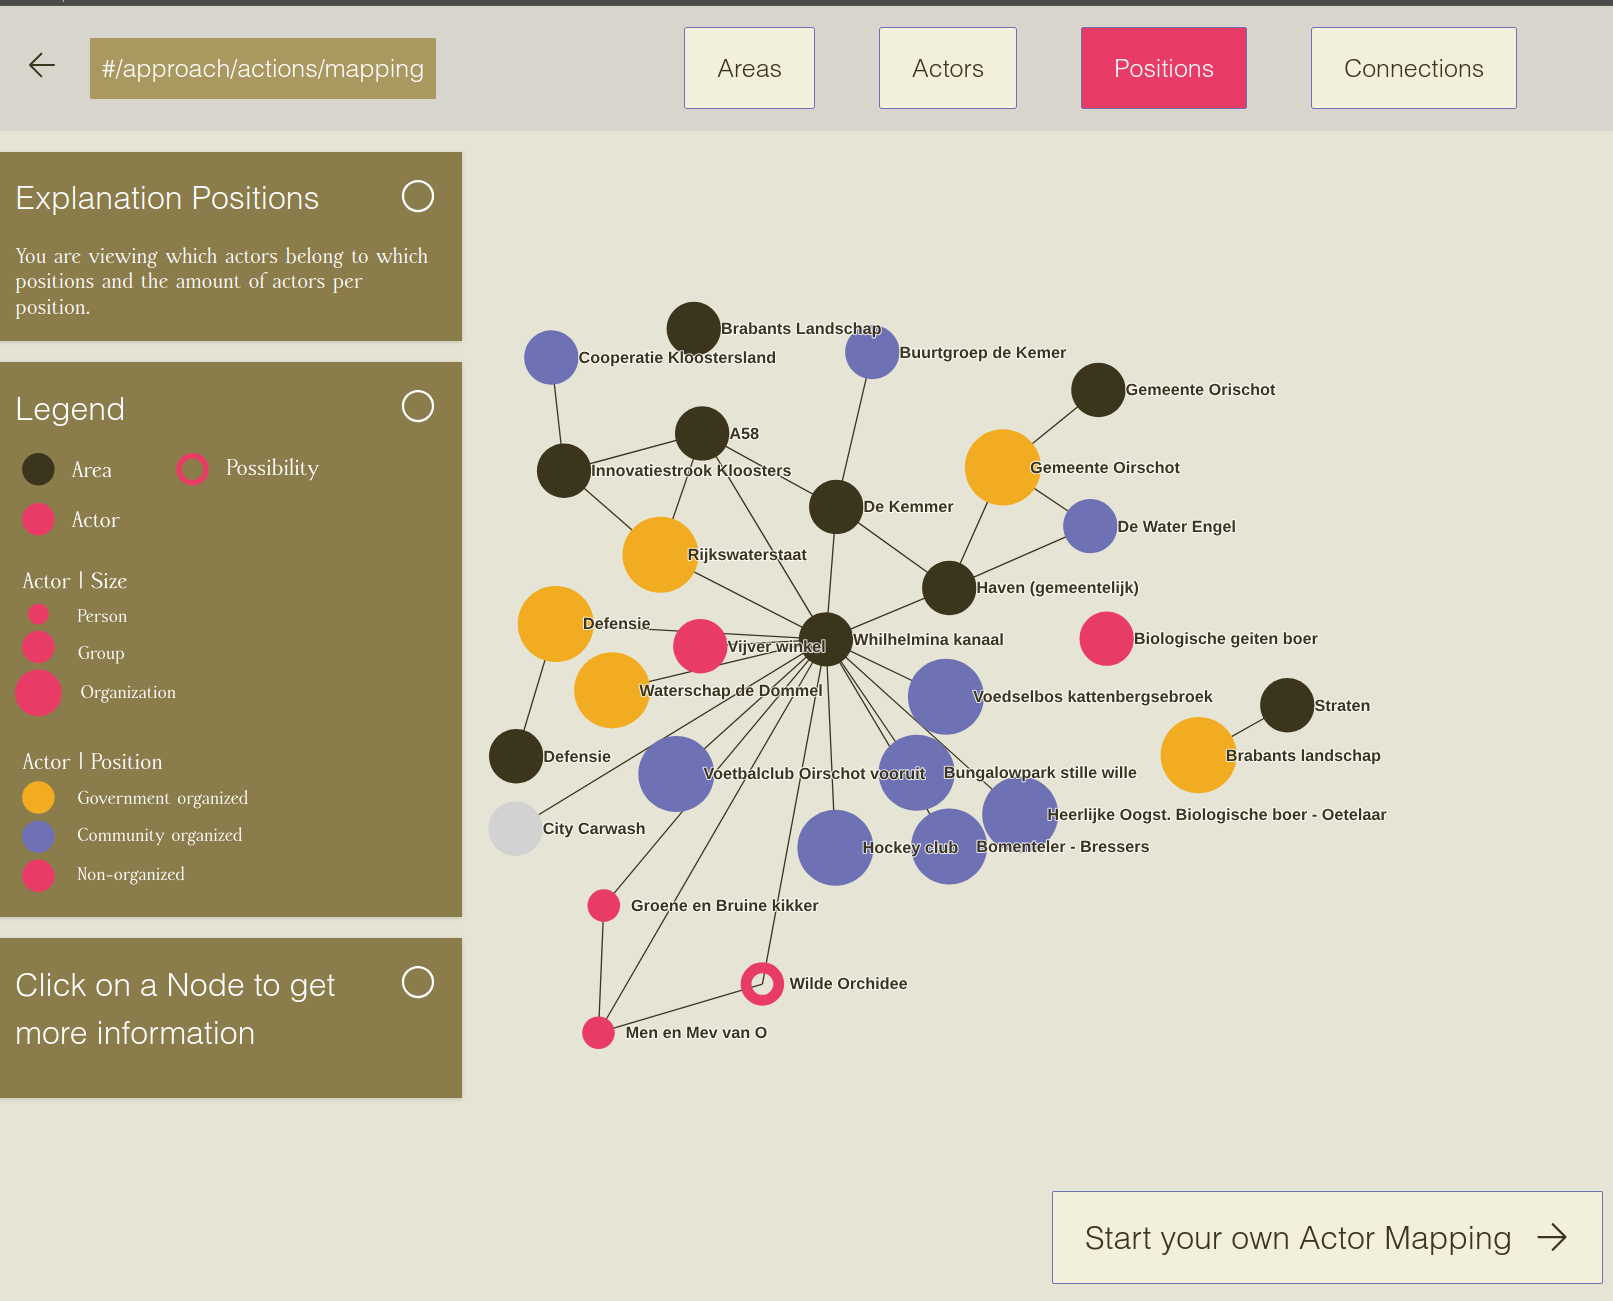
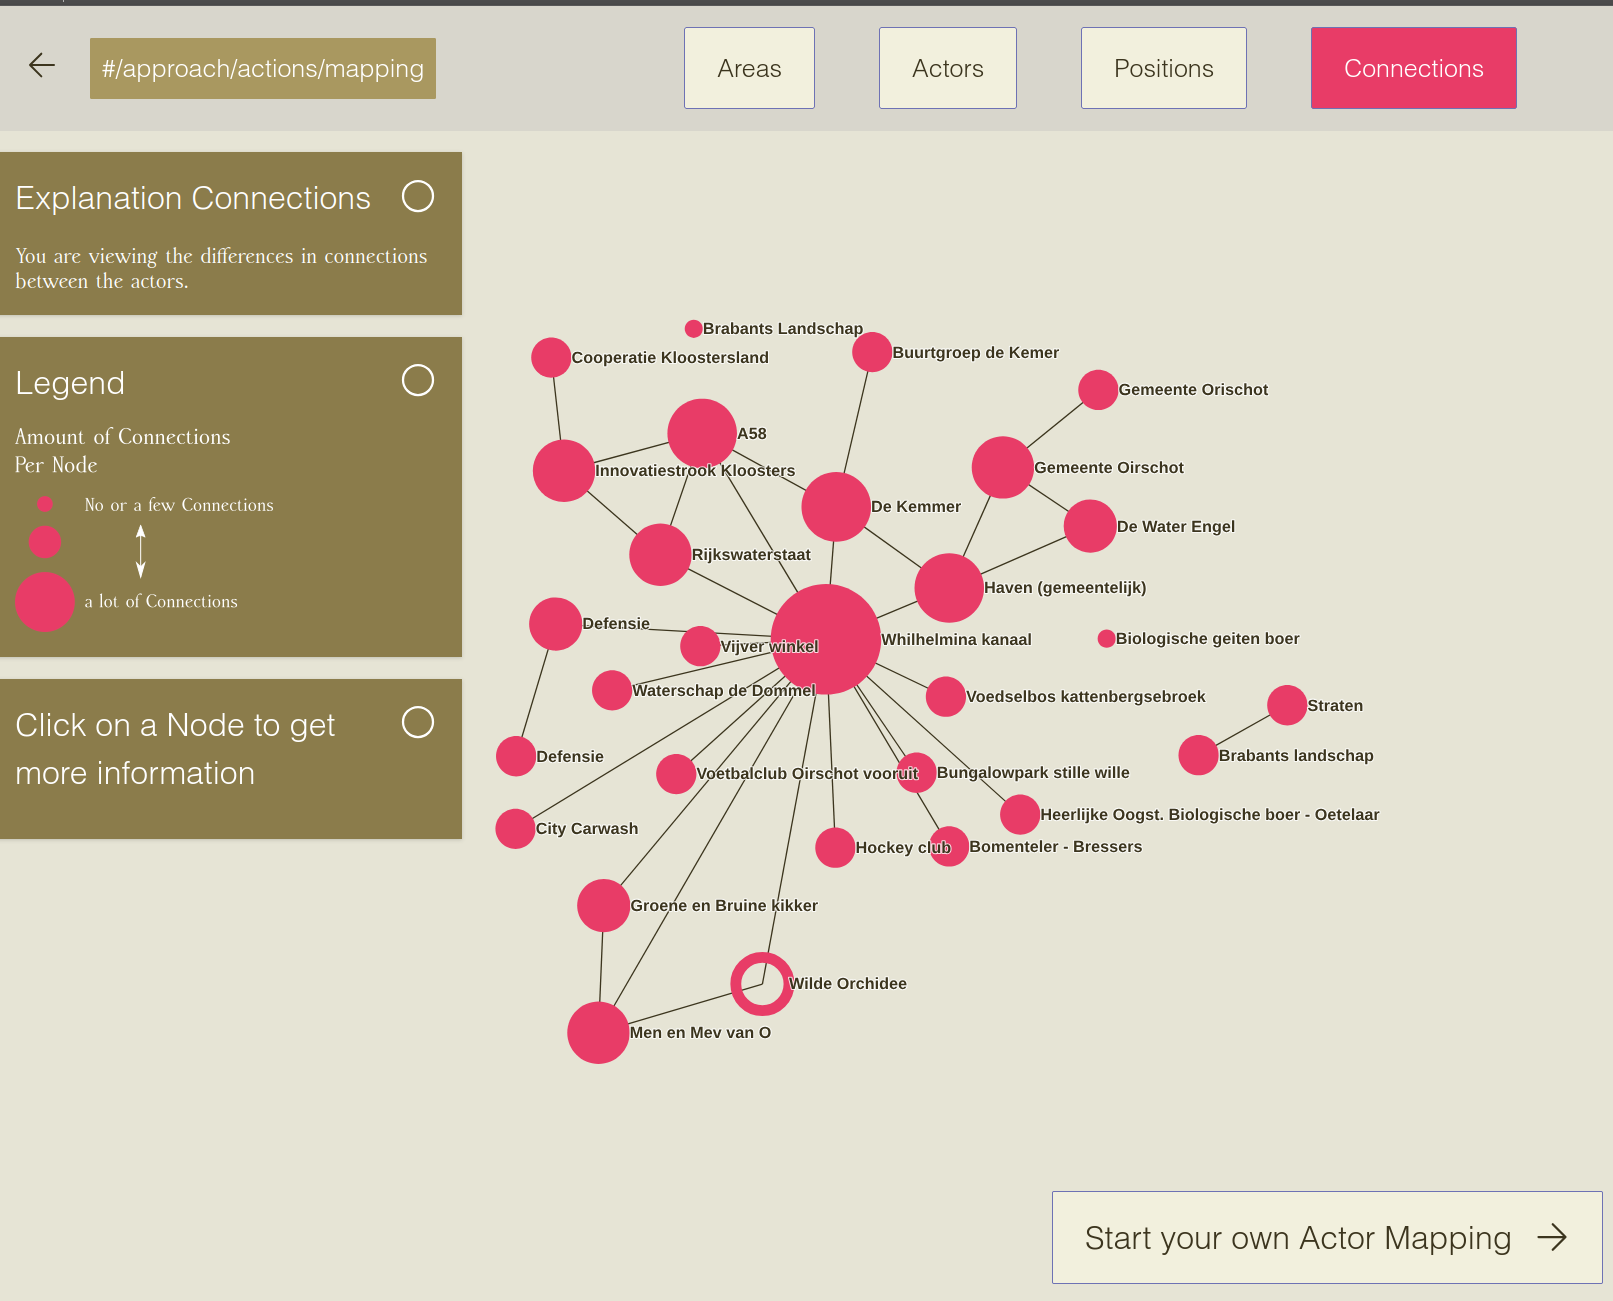
The mapping approach is inspired by a graph network I tested in a Neo4J database and analysis tool. But for quick demo purposed I switched to a hard coded example visualized in d3.js. The tool takes you step by step through how a network graph could be build up for the different actors in a survey area for a participatory approach. Not connecting them only by location on a map but also defining their relations and connections in a spatial form. Looking for possibilities of participation. Again, this was an interesting quest in combining strict technology and a fuzzy participatory process which is often an iterative and dynamic process.
By using their own network in the arrows.app the user is able to upload their graph to the website again to make use of the same visualisation and data model we created for this.
While the whole website and all its sections are interlinked to illustrate the interconnectedness of all its parts. I believe the visualisation and navigation of the website could be improved upon the visually let the user understand even better where in the model they are. Now it is sometimes confusing and you could get “lost” in the information. It demands a lot of investment of the user to understand the approach we designed.
But with working within a small time frame with limited resources I believe the tool is a good starting point of demonstrating how a interactive website and a graph network model can serve to demonstrate the complexity of participatory processes.
Github repro: https://github.com/NieneB/participatory-tool