Voorzitter OSGeo NL
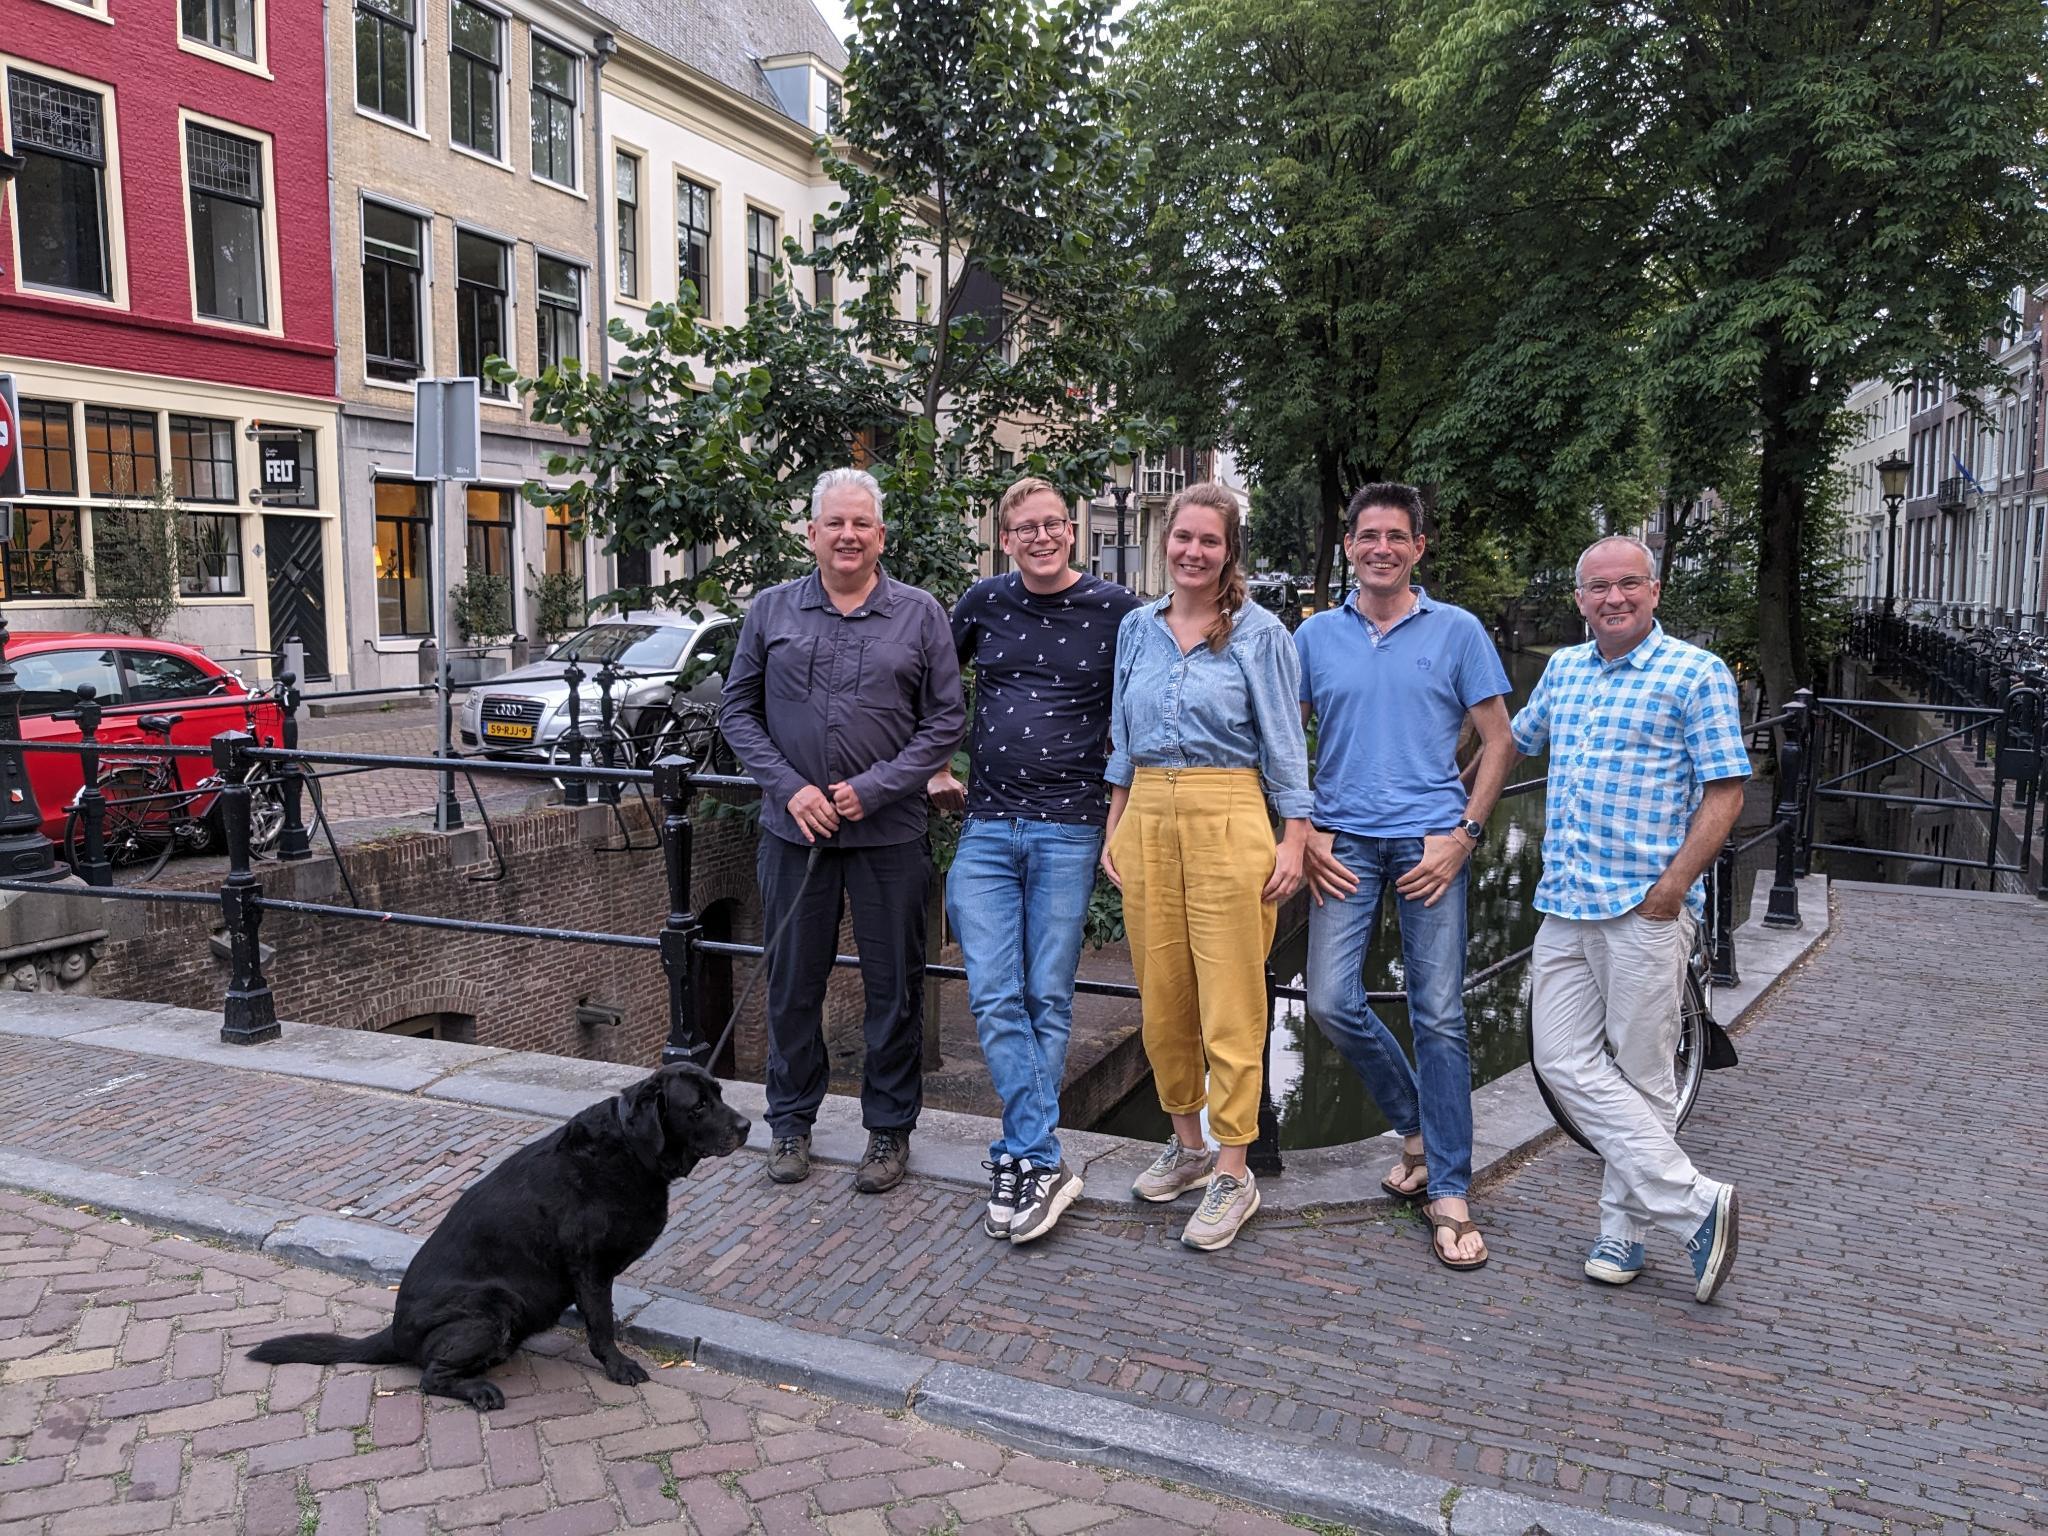
Sinds juli 2023 ben ik begonnen als voorzitter bij de Stichting OSGeoNL.
Datavoorziening Energietransitie
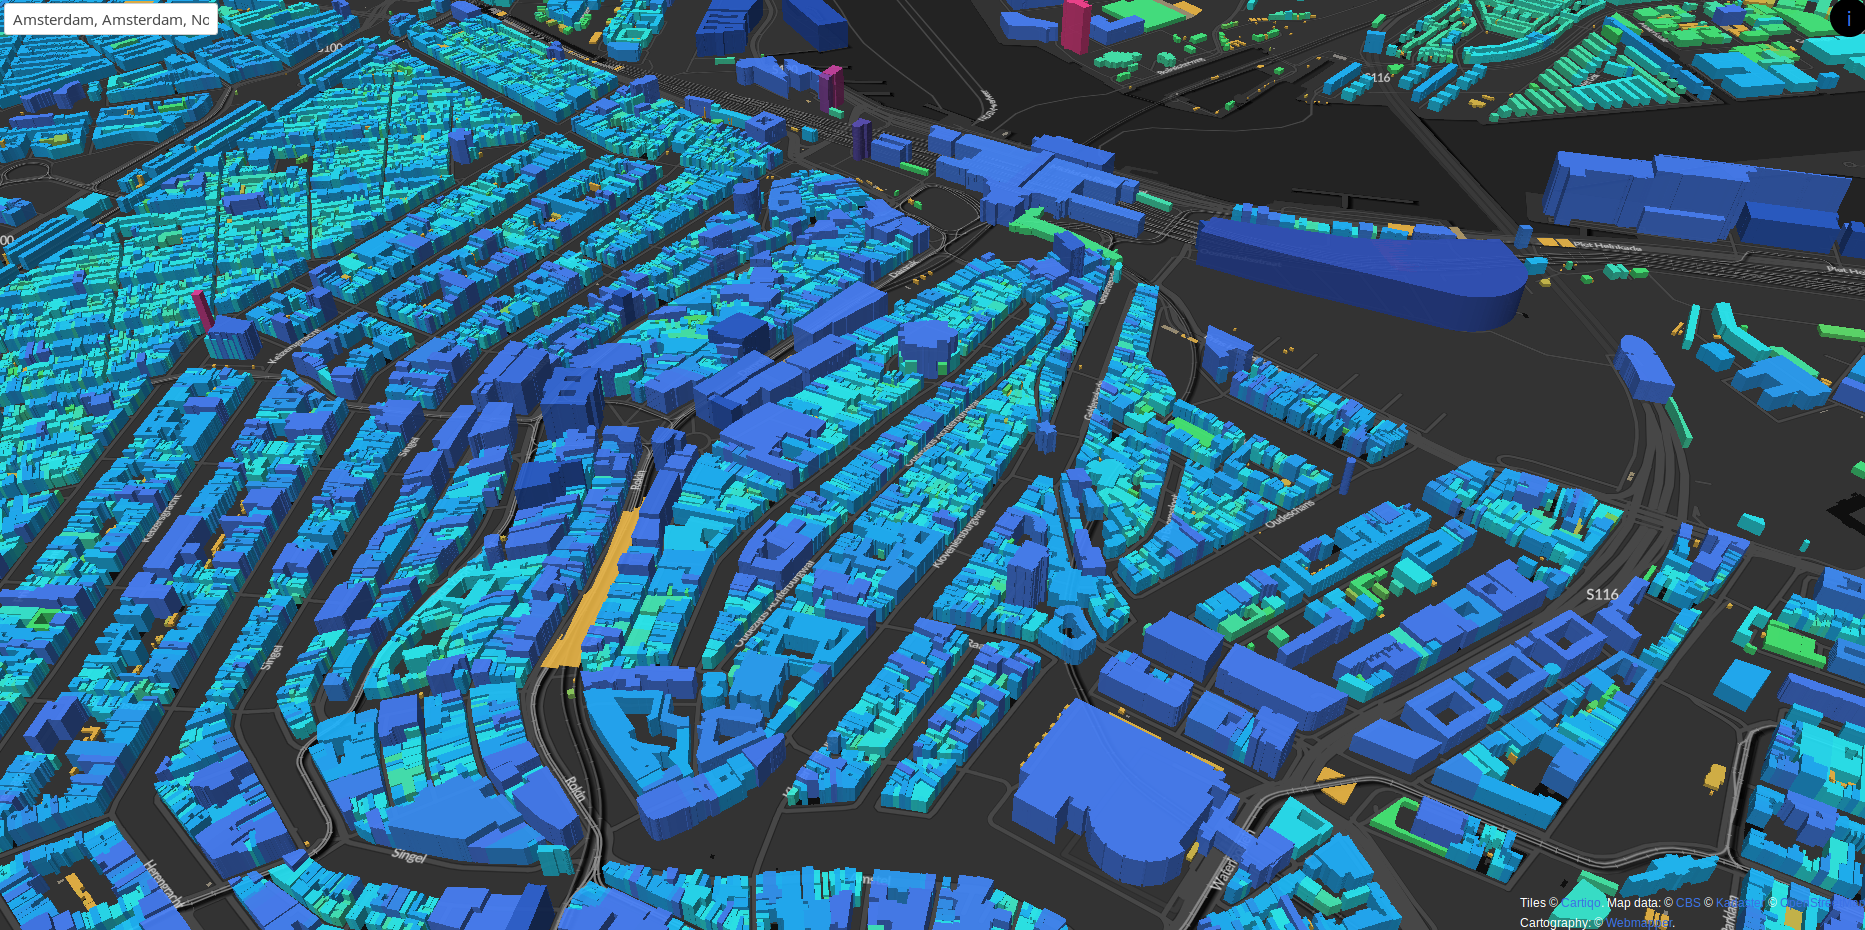
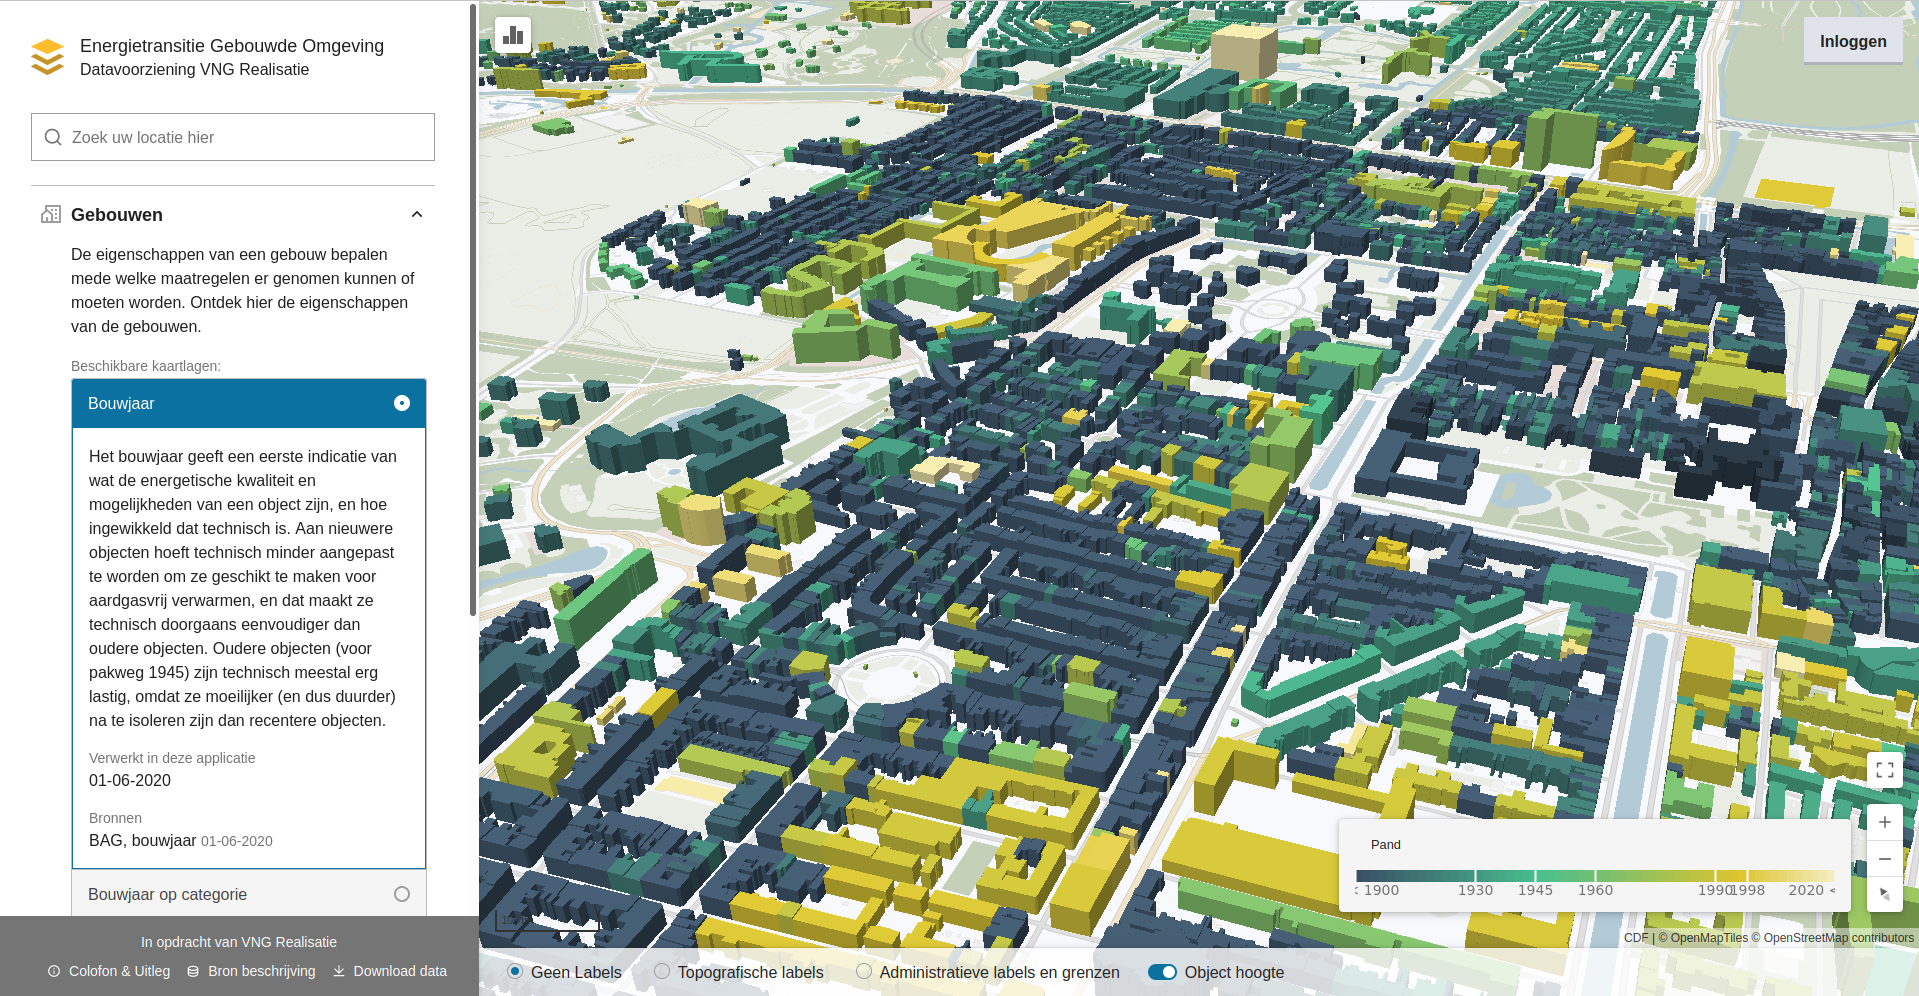
De Datavoorziening Energietransitie Gebouwde Omgeving (DEGO) helpt gemeenten bij het werken met de data die nodig zijn voor het maken van o.a een Transitievisie Warmte. Een gebruiksvriendelijke viewer, die helpt bij het expoloreren van de vele datasets die beschikbaar zijn.
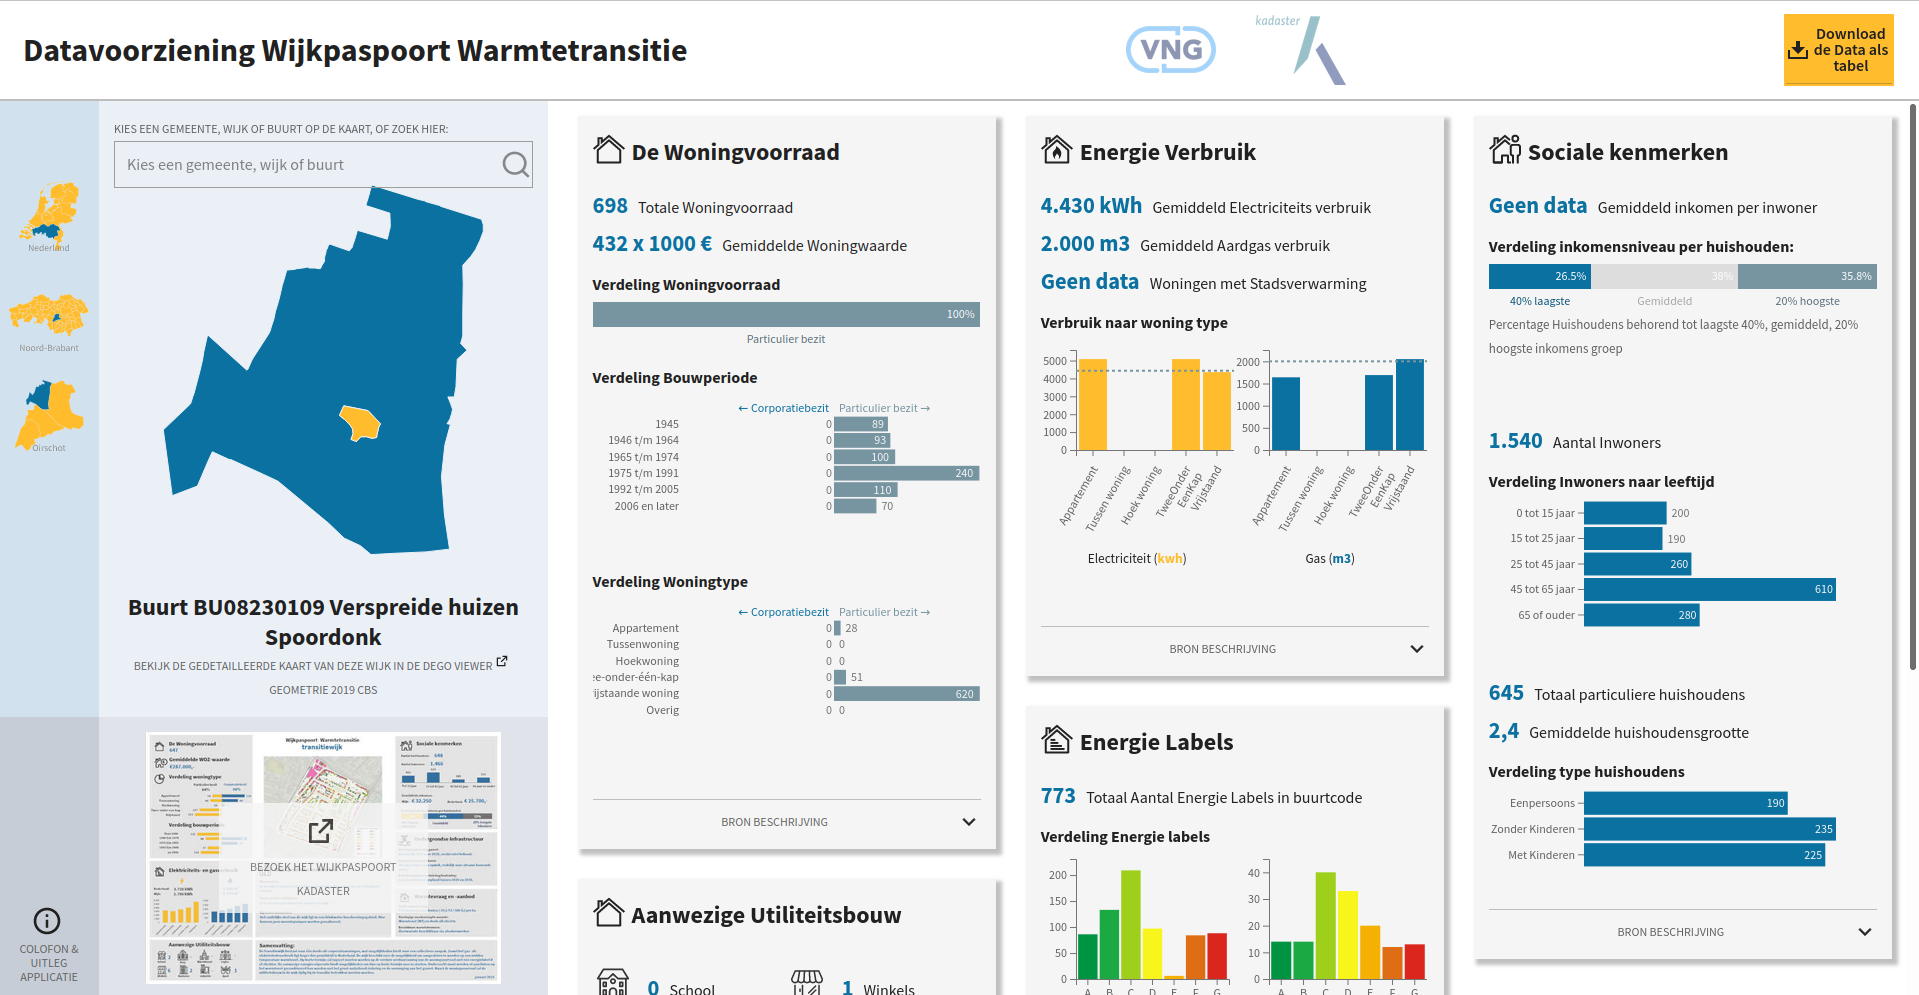
Datavoorziening Wijkpaspoort
De Datavoorziening Wijkpaspoort Warmtetransitie is tot stand gekomen door een samenwerking tussen het Kadaster en VNG. Het Kadaster en VNG zetten zich beide in om gemeenten te ondersteunen bij het datagedreven werken aan de energietransitie in de gebouwde omgeving
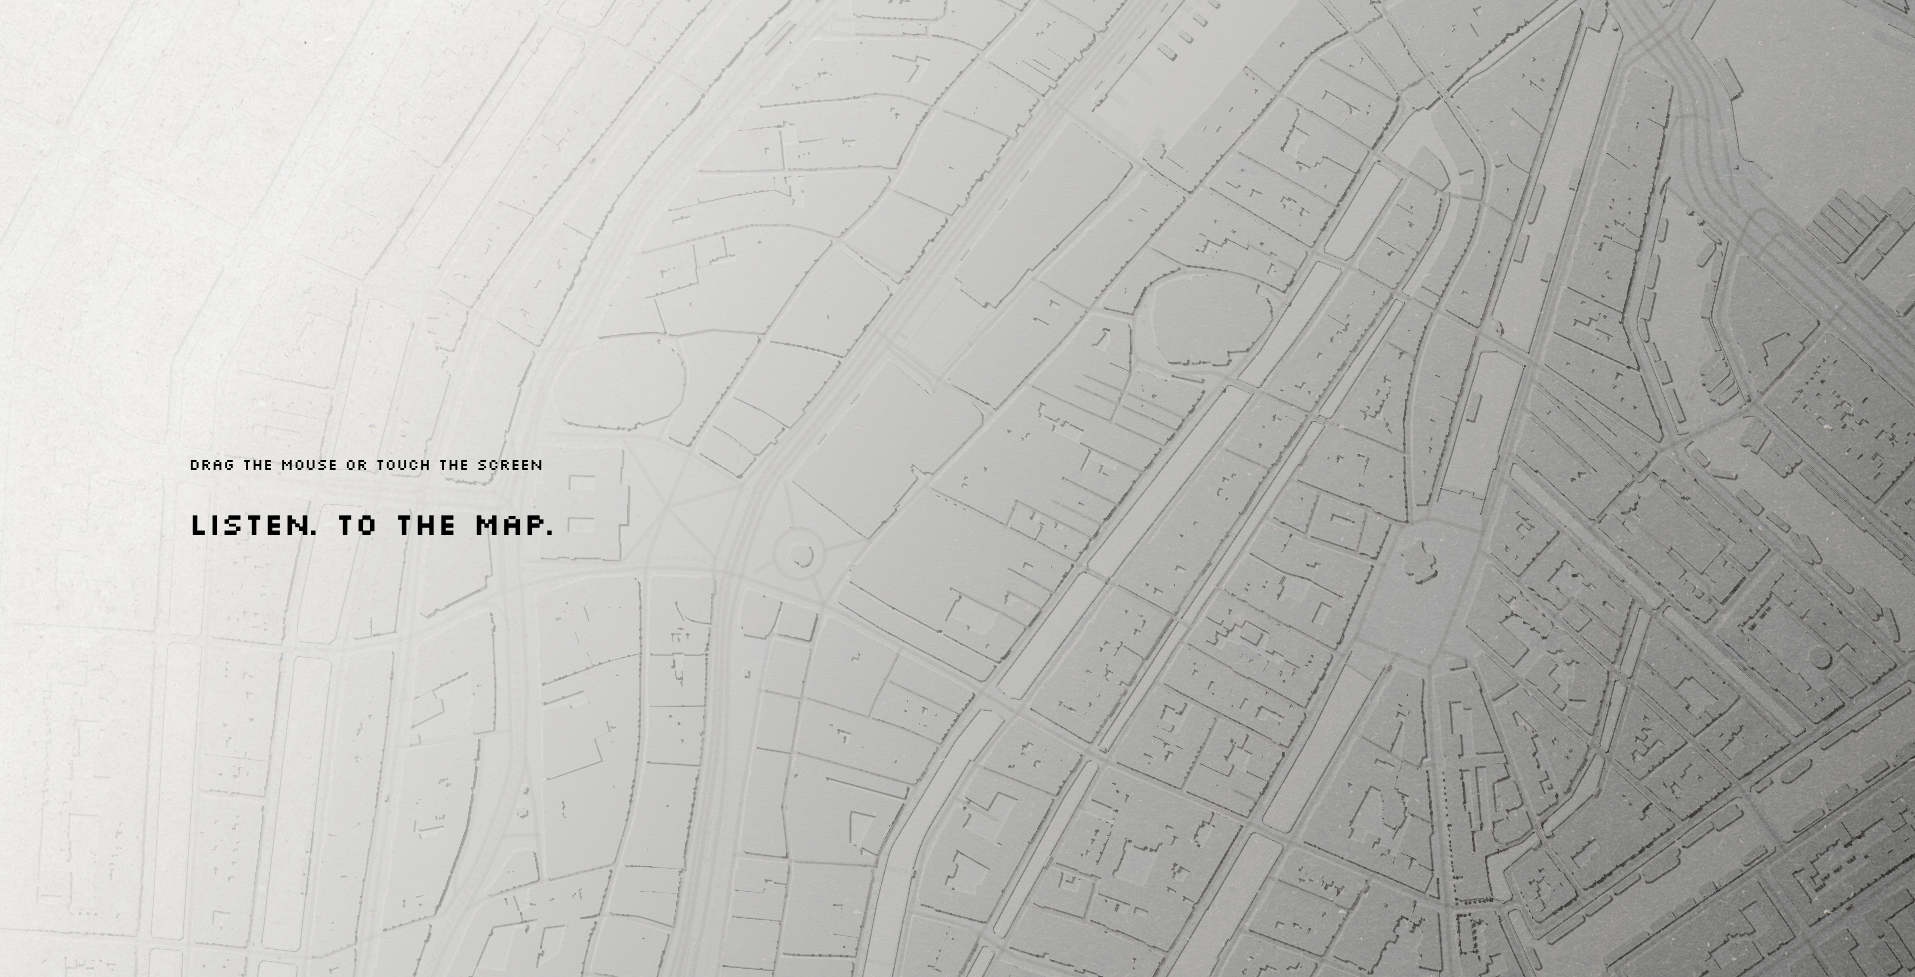
Listen to the map
Simply listen to the data
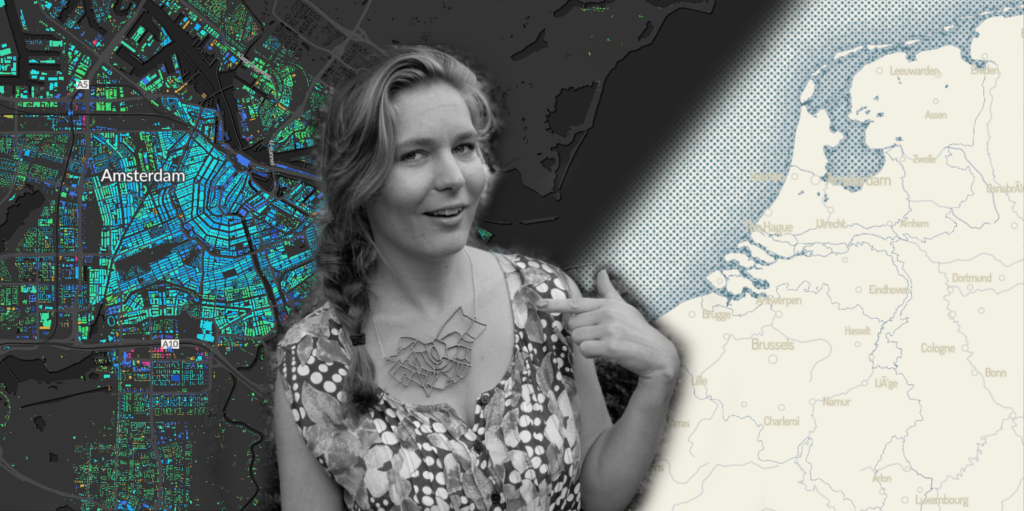
Winnaar: Geo Prestige Award 2019
I am nominated for the Geo Prestige Award 2019 from Geo Info Nederland. Thanks for voting for me because I won!!
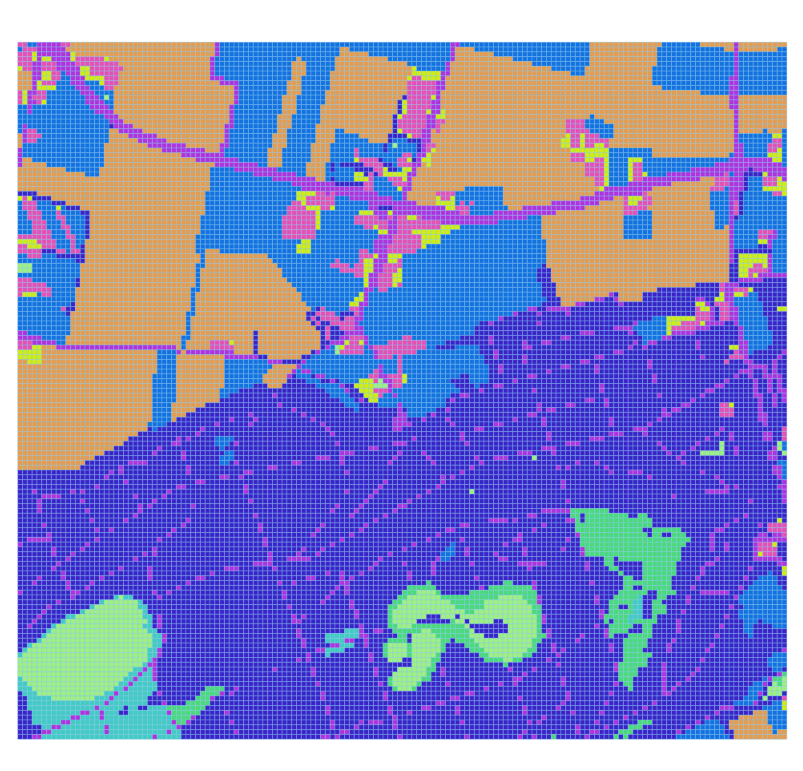
Diamond Painting Map Color Puzzle -- Tutorial!
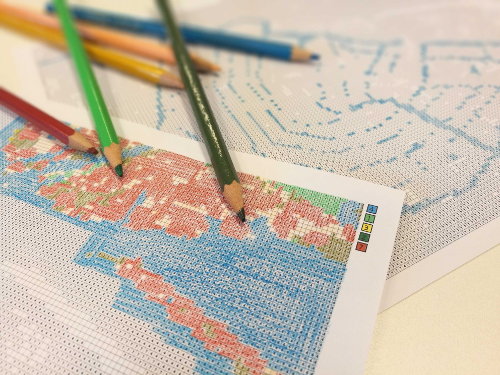
This is a tutorial to make your own diamond painting map color puzzle!
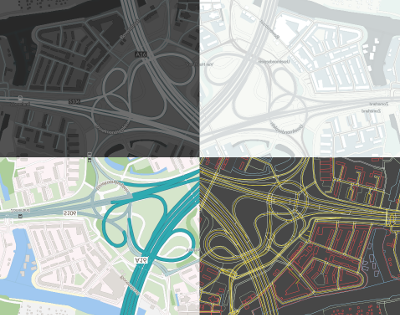
Cartiqo
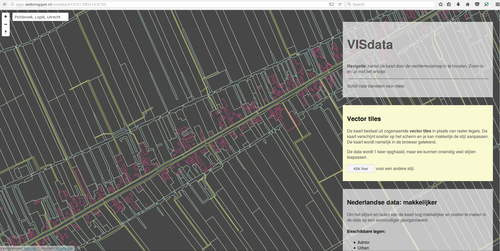
Present your location data on a fast, accurate and beautiful map.

BGT Pastel visualisatie
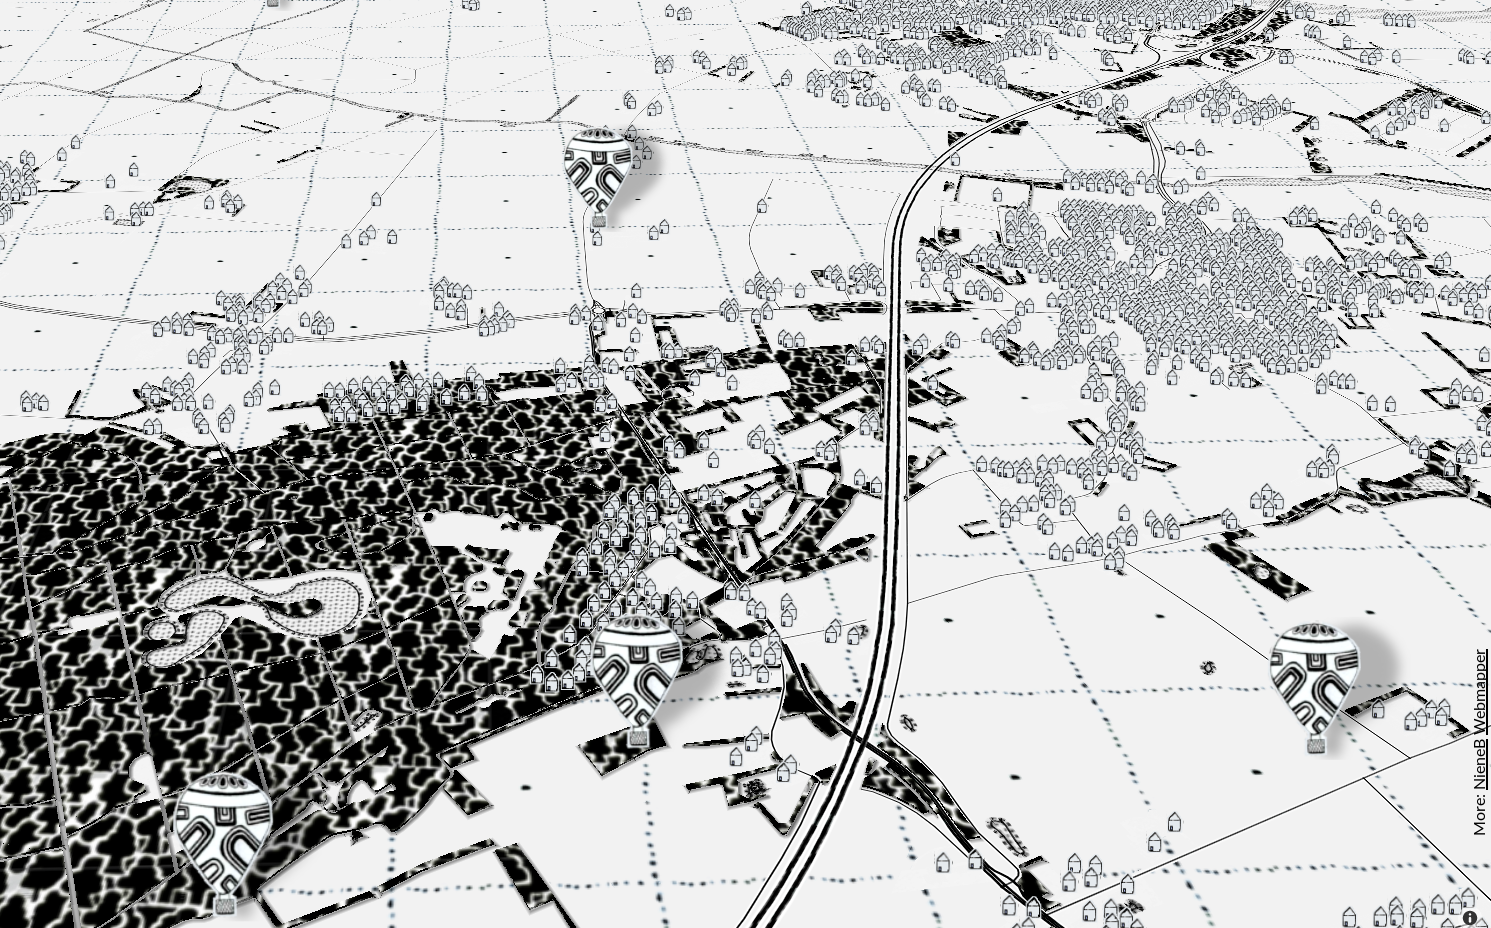
I made the design and Mapfiles of the cartographic style BGT-Pastel
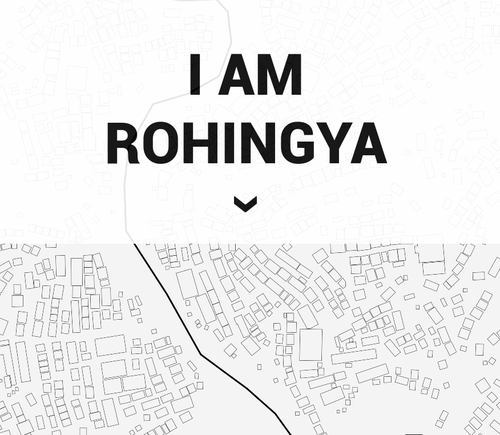
I am Rohingya
Data story about Rohingya refugee camp. Made for the Map challenge of the Cartodag 2018.
